Your one-stop solution, from development to production
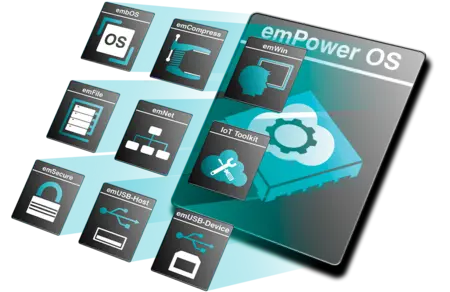
Every project requires a solid foundation. SEGGER’s robust, reliable, and highly efficient software libraries are used to create the application, and they are the building blocks required to compose the code.
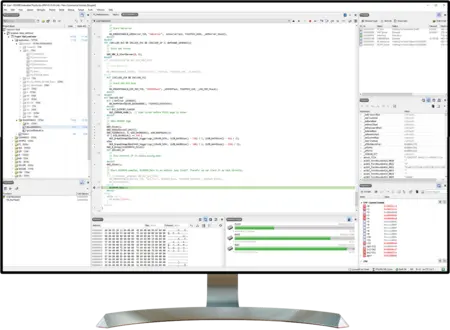
After application code is created, it needs to be transformed into machine-executable instructions. SEGGER’s Embedded Studio is a complete integrated development environment that includes a highly flexible toolchain. Users can optimize speed and resource usage, which often reduces the bill-of-materials costs of the project by reducing the amount of memory required.
The debugging process is a critical part of making an embedded system. SEGGER’s market-leading debug and trace probes help optimize an application in preparation for the final steps in the development process. Critical here are accurate conclusions from reliable debug and trace probes and tools during intermittent test runs.

No project is finished until it has been thoroughly verified. The reliability of the tools used is the key to success. SystemView reveals the true runtime behavior of an application, assisting developers in ensuring that a system performs as intended. Trace, profiling, and coverage analysis make SystemView a powerful performance analyzer that gives users comprehensive insight into the system in question.

The programming process is important in many phases of a project. During verification, programming is used to both transfer the application to the target hardware and to conduct testing afterward. Once the application is finalized, it is deployed to the intended hardware. Together, the application and hardware become the final product.

News


Customer voices

Embedded Studio, embOS, emFile
"Working with SEGGER has been great from the start. The project got off the ground quickly, evolved well, and is running smoothly. As long as our targets are supported, we have no reason to use any tools other than those from SEGGER."
// Christof Kerschbaumer, ekey, Linz, Austria


"SEGGER's debugging tools and software libraries are a key part of Polar's firmware development. With their help, we can adapt new component technologies to our products in such a way that our design schedules are predictable, and the end products meet strict quality requirements."
// Markku Karjalainen, Polar Electro, Helsinki, Finland
Partners


Silicon Vendors Resource Center
Ecosystem partnership
SEGGER is open to co-marketing activities, and it offers valuable services for your existing and new devices. Become a SEGGER partner, and let us help you build a complete ecosystem for your devices. Ask us about:
- Collaborative marketing opportunities
- J-Link Prime
- RTOS/embedded software BSPs
- Memory-device support
- Silicon vendor buyout (object-code redistribution)