SEGGER News
Welcome to the News section, your hub for the latest updates and insights from SEGGER.
- J-Link
- J-Trace

SEGGER announces a beta release of their new J-Link Debugger
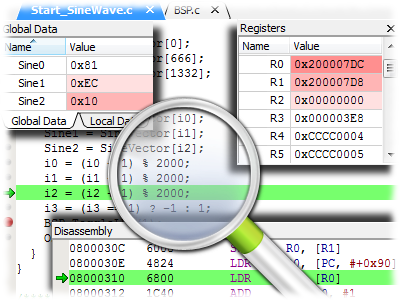
With J-Link Debugger it is possible to debug any embedded application on the C source and assembly language level. It can load applications built with any toolchain/IDE or debug the target's resident application without any source.
J-Link Debugger increases development speed by extending the rich feature set and robust high performance of the J-Link/J-Trace family of debug probes. Scriptable project files automate setup making it easy to get started.
Ultra-fast flash downloads, an unlimited number of breakpoints even when debugging in flash memory and the SEGGER Real-Time-Terminal are all features which may be utilized from within the SEGGER J-Link Debugger. The SEGGER Real-Time-Terminal feature alone will drastically change the way in which debugging is done.
Used with one of the high-end trace models (J-Trace Cortex-M) the J-Link Debugger supports instruction trace.
“SEGGER J-Link Debugger is the latest addition to the extensive family of J-Link software tools which include J-Flash, J-Link Commander, J-Link GDB Server, J-Link RDI/RDDI, J-Scope, J-Link SWO Viewer, and J-Mem,” says Alexander Gruener, Product Manager of the SEGGER J-Link family of debug probes.
More information about J-Link Debugger can be found here:
www.segger.com/j-link-debugger.html
More information on J-Link is available at:
www.segger.com/jlink.html
About J-Trace
J-Trace is the most feature rich offering of the J-Link family adding instruction trace capabilities using ARM’s Embedded Trace Macrocell (ETM). The J-Trace models have an internal trace memory. Their direct interface to the ETM allows maximum trace frequency. ETM instruction trace allows the developer to look at the history of a program’s execution. This is useful, for example, when a program crash is caused by an unexpected jump. In this case the developer can track back to where the program execution left its intended flow. Full product specifications are available at: www.segger.com/j-trace-for-cortex-m.html
About J-Link
The SEGGER J-Link is the most popular debug probe on the market. It is tool chain independent and works with free GDB-based tool chains such as emIDE and Eclipse, as well as commercial IDEs from: Microchip (MPLAB® X), Atmel, Atollic, Coocox, Cosmic, Freescale, IAR, KEIL, Mentor Graphics, Python, Rowley, Renesas, Tasking and others. With the J-Link family, investments in the debug probe are preserved when changing compiler or even CPU architecture. J-Link supports multiple CPU families, such as ARM 7, 9, 11, Cortex-M0, M0+, M1, M3, M4, R4, A5, A8, A9 as well as Renesas RX100, RX200, RX610, 620, 62N, 62T, 630, 631, 63N and Microchip PIC32; there is no need to buy a new J-Link or new license when switching to a different yet supported CPU family or tool-chain. SEGGER is also continuously adding support for additional cores, which in most cases, only requires a software/firmware update. Unlimited free updates are included with even the baseline model of the J-Link family. SEGGER is excited to continue advanced development of its cutting edge embedded tool solutions to be utilized with pretty much any development environment you choose. All J-Links are fully compatible to each other, so an upgrade from a lower-end model to a higher-end model is a matter of a simple plug-and-play.
Full product specifications are available at: www.segger.com/jlink.html
The J-Link-Software is available at: www.segger.com/download_jlink.html
U.S. On-Line Web Shop: http://shop-us.segger.com
Online Shop (Europe, Asia, Africa): http://shop.segger.com