SEGGER News
Welcome to the News section, your hub for the latest updates and insights from SEGGER.
- J-Link
- J-Trace

SEGGER makes Processor Trace Debugging affordable
Tool-chains for embedded systems development no longer need to create their own complex decoder. They can use the new Simple Trace API (Simple-TRACE) from SEGGER. Even free GNU-based offerings will be able to add Trace capabilities to their tool-chain with little effort. They need to implement the display of the data only, as the data is already analyzed and neatly packaged by SEGGER.
“Simple-TRACE is a forward-looking enablement technology which will revolutionize the market by making trace available to everyone. Without Simple-TRACE, IDE developers would have to invest great time and resources to add full trace analysis and then would likely need to pass this cost along to their customers. This is no longer the case with Simple-TRACE and will dramatically change the way you debug”, says Dirk Akemann, Marketing Manager of SEGGER.
“Until now, an IDE developer would have to write his own trace data analyzer to support instruction trace. By using Simple-TRACE the IDE developer can save development time while knowing that the trace data will be accurately and reliably gathered via the industry standard debug and trace probe. His task is reduced to displaying the pre-analyzed data provided by our API. We urge you to give it a try, you’ll be impressed”, says Alexander Grüner, Product Manager of the J-Link/J-Trace family.
Using instruction trace with Simple-TRACE requires an instruction trace cell inside the target microcontroller and SEGGER’s J-Trace. If the target microcontroller has an internal trace buffer, Simple-TRACE also works when using any J-Link model available from SEGGER. Apart from this requirement, Simple-TRACE is completely independent from the processor being used.
About J-Trace
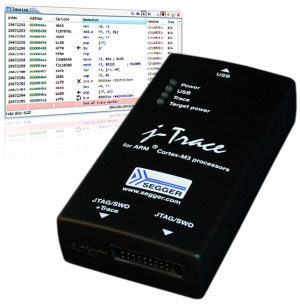
J-Trace is the most feature rich offering of the J-Link family adding instruction trace capabilities using ARM’s Embedded Trace Macrocell (ETM). The J-Trace models have an internal trace memory. Their direct interface to the ETM allows maximum trace frequency. ETM instruction trace allows the developer to look at the history of a program’s execution. This is useful, for example, when a program crash is caused by an unexpected jump. In this case the developer can track back to where the program execution left its intended flow. Full product specifications are available at: https://ww.segger.com/j-trace-for-cortex-m.html
About J-Link
The SEGGER J-Link is the most popular debug probe on the market. It is tool chain independent and works with free GDB-based tool chains such as emIDE and Eclipse, as well as commercial IDEs from: Microchip (MPLAB® X), Atmel, Atollic, Coocox, Cosmic, Freescale, IAR, KEIL, Mentor Graphics, Python, Rowley, Renesas, Tasking and others. With the J-Link family, investments in the debug probe are preserved when changing compiler or even CPU architecture.
J-Link supports multiple CPU families, such as ARM 7, 9, 11, Cortex-M0, M0+, M1, M3, M4, R4, A5, A8, A9 as well as Renesas RX100, RX200, RX610, 620, 62N, 62T, 630, 631, 63N and Microchip PIC32; there is no need to buy a new J-Link or new license when switching to a different yet supported CPU family or tool-chain. SEGGER is also continuously adding support for additional cores, which in most cases, only requires a software/firmware update. Unlimited free updates are included with even the baseline model of the J-Link family. SEGGER is excited to continue advanced development of its cutting edge embedded tool solutions to be utilized with pretty much any development environment you choose. All J-Links are fully compatible to each other, so an upgrade from a lower-end model to a higher-end model is a matter of a simple plug-and-play.
Full product specifications are available at: www.segger.com/jlink.html The J-Link-Software is available at: www.segger.com/download_jlink.html U.S. On-Line Web Shop: https://shop-us.segger.com Online Shop (Europe, Asia, Africa): https://shop.segger.com